Visualize
2019
Creative Development
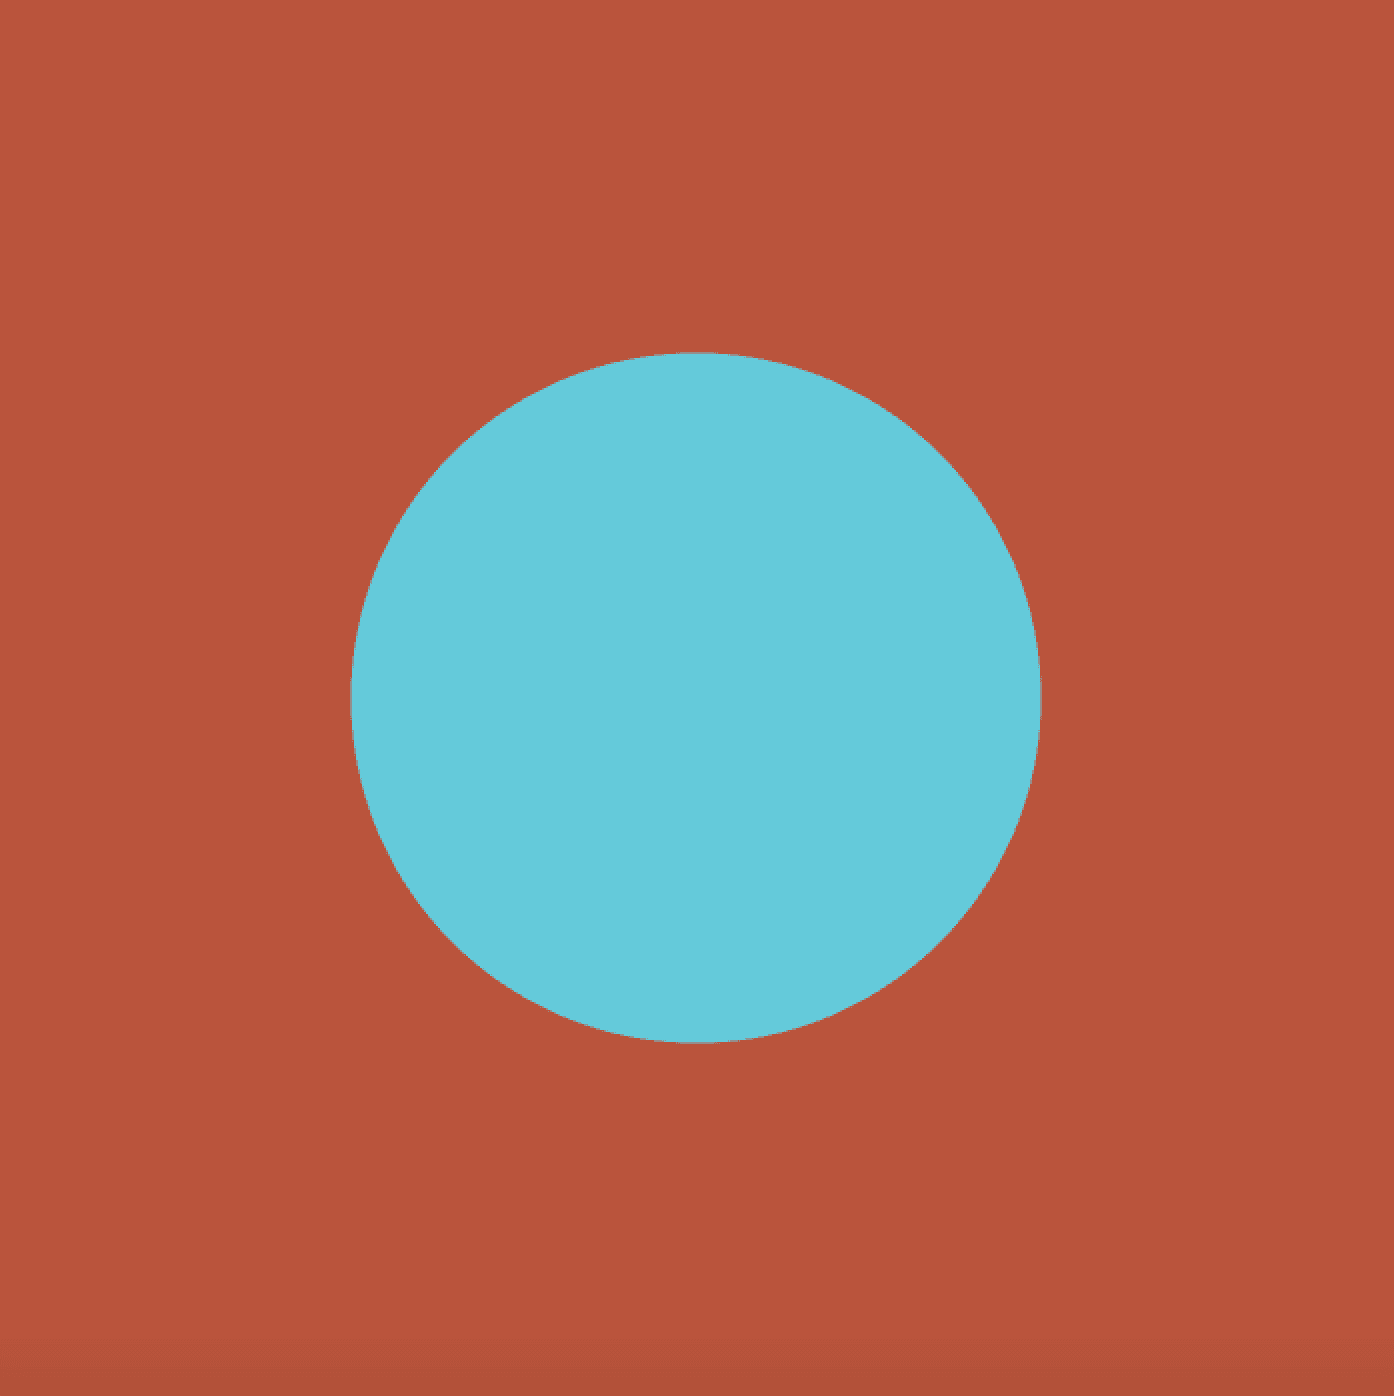
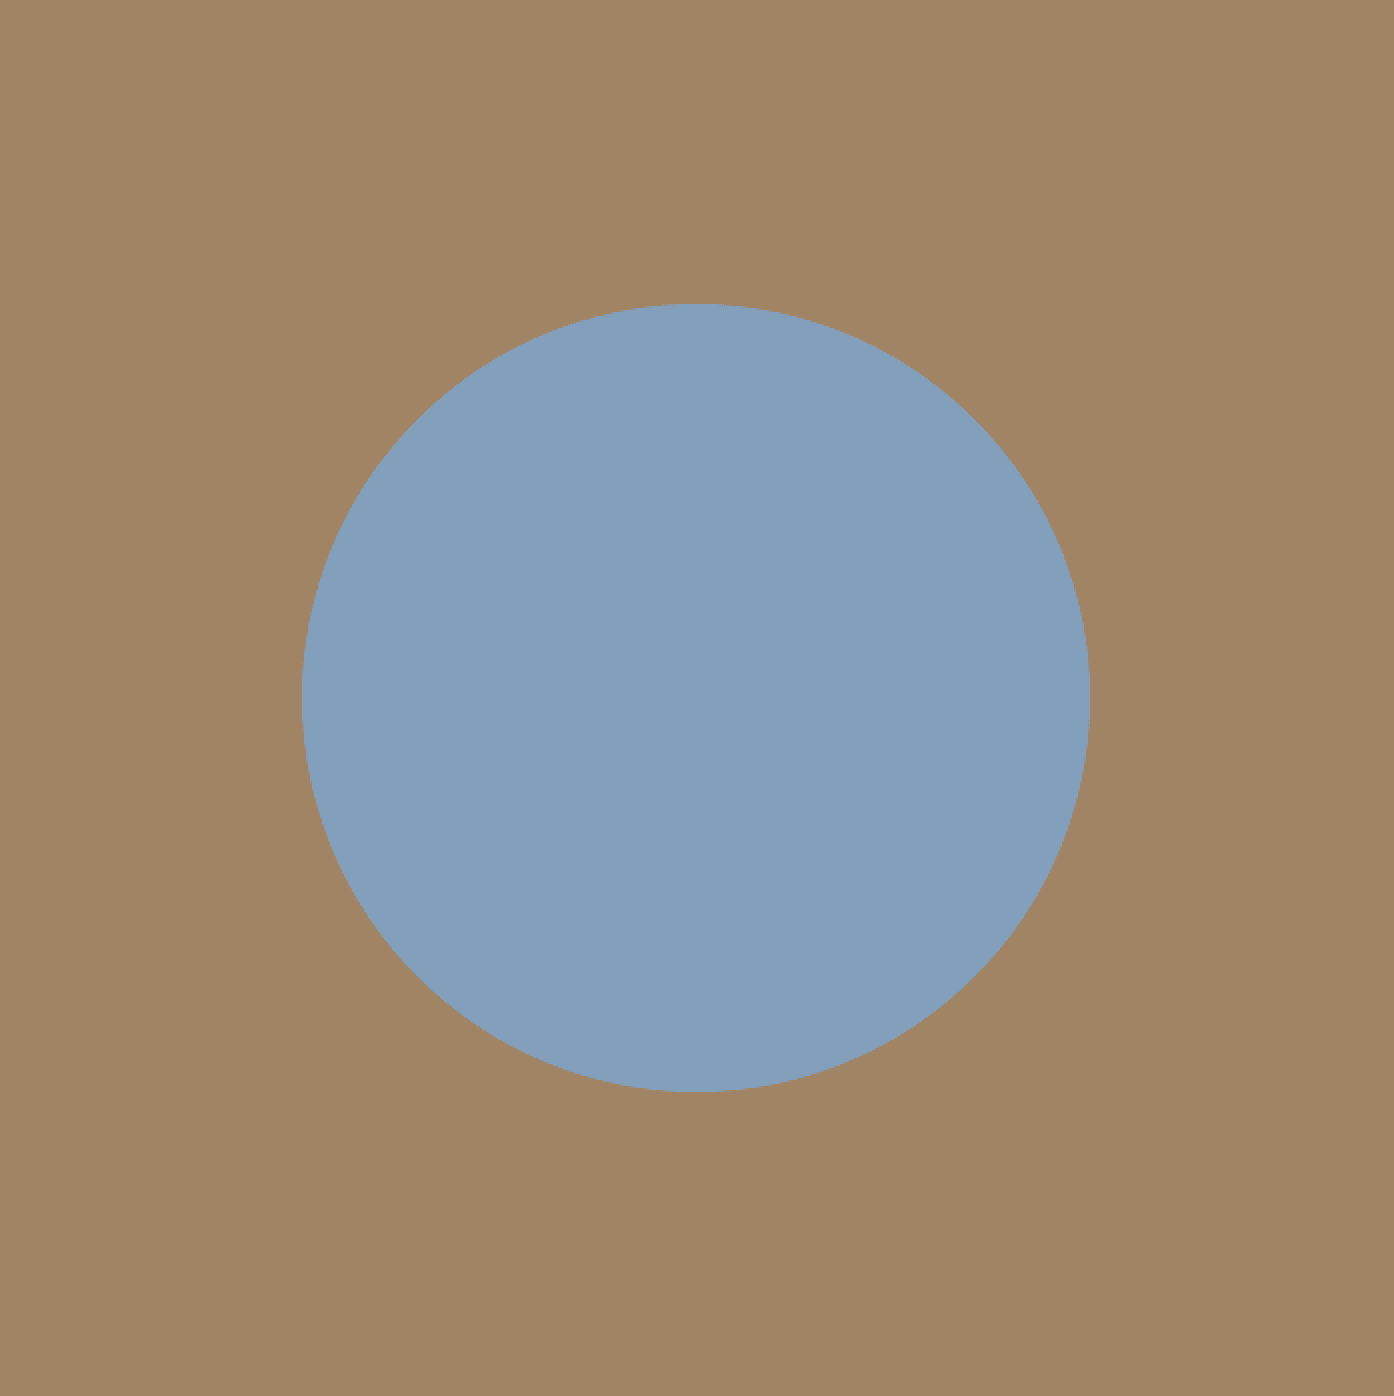
This program flattens sound frequency into color. The frequency detected maps to the color of the center circle. The circle's size is determined by the amplitude of the sound wave, how loud it is. The background color is the negative of the foreground. Higher frequencies of sound translate to brighter colors and vise-versa. This one is set to Frank Ocean's cover of At Your Best (You Are Love), by Aaliyah.